 For correct and profitable trading of binary options , it is necessary to use approaches such as money management and risk management , and for successful forecasting and making accurate transactions, one cannot do without a suitable type of analysis, one of which is technical analysis of binary options.
Technical analysis of binary options has many types and methods of use, but its essence always comes down to determining entry points into a transaction, and in the case of trading on the Forex market , exit points.
Basics of technical analysis of binary options
When trading binary options, technical analysis for novice traders is necessary to obtain a correct forecast of upcoming price movements, based on patterns of price changes in the past under similar circumstances. To put it simply, technical analysis of binary options is always carried out on a chart using past prices (historical data), since history very often repeats itself.
Technical analysis for BO is based on three main axioms (they are not the only ones):
- Everything is included in the price. Every event that can change the movement of quotes is immediately reflected on the price chart, be it the release of news that affects the world economy, a political coup or a global epidemic. Having mastered binary options and technical analysis for beginners, you can do without fundamental analysis .
- The price moves according to the trend (vector). A trend or price direction formed in a certain period of time will in most cases be a determining factor in the future. This means that if an upward trend is formed, for example, on the daily timeframe , then even with deep pullbacks in the opposite direction, the price will almost always continue to move in the direction of this trend. This is especially noticeable on smaller timeframes, such as hourly, where the price may fall within a day, but this does not mean that the global trend is downward. The trend can also be downward. Technical analysis of binary options for dummies, which we will talk about in more detail later, will help you understand how to determine the trend and open trades in the right direction.
- The past repeats itself in the future. Market dynamics largely depend on human psychology and the same type of reaction to similar situations. This confirms the formation of the same graphic patterns, which have long been classified and repeated over many years. If a figure worked in the past, there is reason to believe that it will work in the future, since people's psychology does not change.
In order for a trader to be able to conduct high-quality technical analysis for trading BOs, he needs to know:
- what types of charts are most suitable for technical analysis;
- how does a trend work?
- What is volatility?
Next, we will consider each of these points in more detail.
Types of charts
Using technical analysis of binary options for beginners, you can predict any market (stocks, futures, cryptocurrencies ), but technical analysis provides the greatest benefit when predicting prices for currency pairs . You can use any types of graphs for analysis:
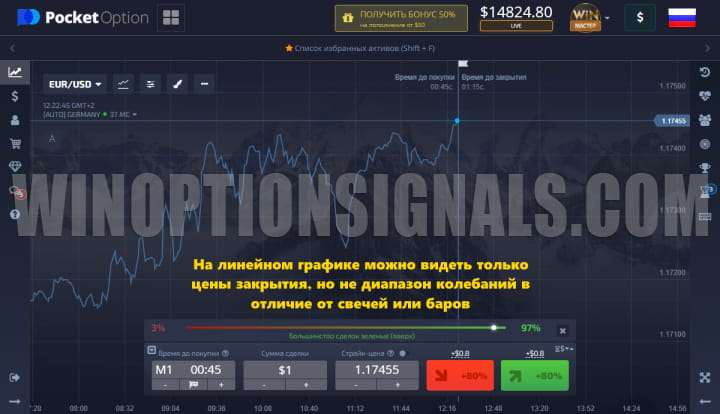
- Linear. Recommended for short periods (several minutes), since it only shows the closing price of the time period.
- Bar chart. Used for a period of five minutes. The histogram depicts the high and low prices, as well as the opening and closing prices.
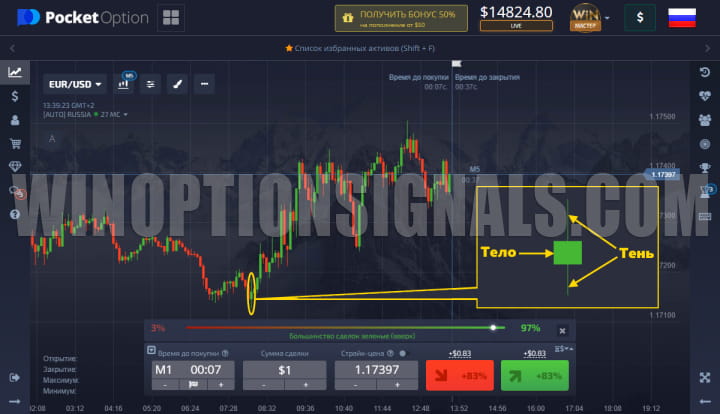
- Japanese candles. A type of chart in which the body of the candle represents the price between the open and close, and the shadow represents the high and low price values during that time period.
- Bars. A type of chart that is structured like candlesticks, but has a slightly different shape.
A line chart is one of the simplest and represents segments between quote values at the closing moment, connected by a solid line. It is built based on price level points. For example, on the daily timeframe (D1), the line will follow the prices that existed in the last second of each trading day. The chart does not show volatility and does not provide information to what level the price rose or fell during a particular day:
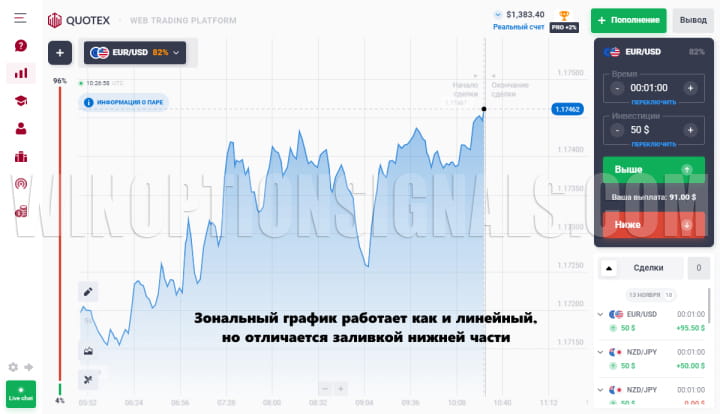
A zonal graph is built on exactly the same principle as a linear graph, but usually either the lower or upper part can be shaded, which makes the graph look like mountains:
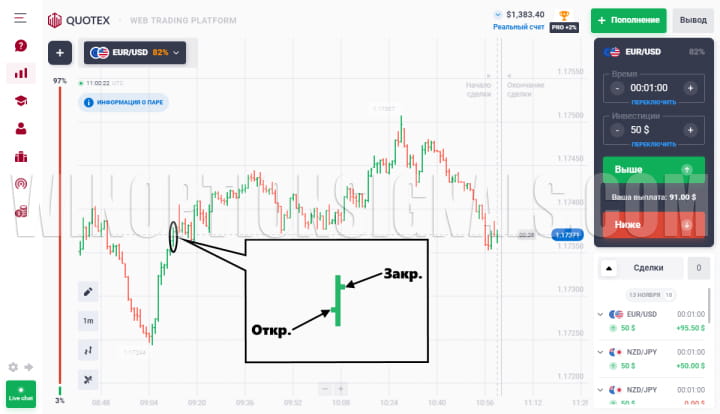
The most commonly used in the application of technical analysis of binary options is the candlestick chart, since it most conveniently displays the price values of the time frame used. Japanese candlesticks provide much more information about the market situation. Each candle displays four types of quote information:
- opening price;
- closing price;
- maximum price;
- minimum price.
All this data can be seen on the chart due to the fact that candles include a “body” and “shadows”. The body displays the opening and closing prices, and the color of the candle can determine whether the closing price fell or increased compared to the opening level. Shadows reflect the highs and lows of the price that were reached at the moment. Thanks to this, you can see the full movement of quotes:
Bars provide the same information as candles, but differ in their appearance. And note that the opening and closing of a bar can be determined not by the body, but by short horizontal lines on the sides of the bar:
Types of trend
The ability to identify a trend is a very important skill in trading, since most strategies and indicators are built on trend trading, and therefore without understanding the trend, it is unlikely that you will be able to make profitable binary options trades.
A trend is a unidirectional price movement, and at the same time it can be both strong and weak:
Also, all types of trends are divided by duration:
- Short term trend . Lasts up to 2 weeks.
- Medium-term trend . Lasts from 2 weeks to 6 months.
- Long term trend . Lasts from 6 months to several years.
Note: in the same way, you can separate the types of trades and the duration of transactions.
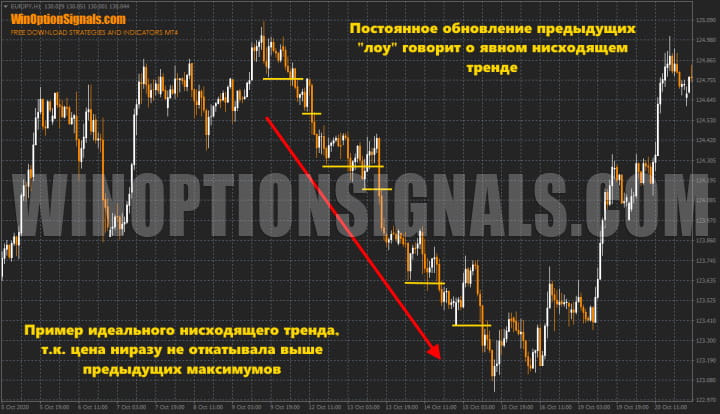
Before starting binary options trading, technical analysis for novice investors should show which direction the price is heading. An upward movement means that the next maximum and minimum values of quotes will be higher than the previous ones, and vice versa - with a downward trend, the minimum and maximum prices will decrease.
Technical analysis of binary options does not ignore the definition of flat , since flat is an important part of any market and, according to statistics, all markets spend most of their time in flat. A flat can be observed when the price does not have a clearly directed movement vector and is in a sideways range, which is called a flat.
In order to fully consolidate your understanding of how to determine a trend, it is also worth understanding what a bullish and bearish trend is , as well as what are trend phases .
Volatility
Volatility is the dynamics of market price fluctuations. It can be strong or weak depending on how much the asset price deviates from the average.
The degree of volatility must be taken into account when performing technical analysis of binary options and making decisions when opening positions. The more volatile an asset, the more difficult it is to predict its movement. But, on the other hand, when volatility is high, sharp impulses can bring significant benefits to the trader. It is best to use highly volatile trading assets to buy turbo options with expiration from 60 seconds to 5 minutes, so that quotes do not have time to return to average values.
For example, you can consider the daily volatility of the EUR/USD pair for the period from April 2020 to March 2021:
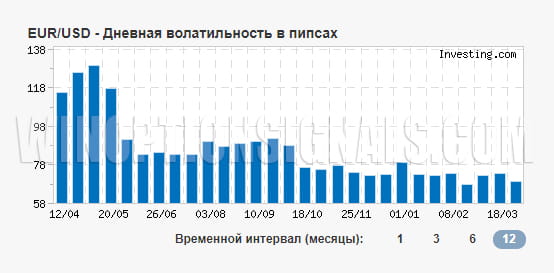
As you can see, the volatility of the asset decreases throughout the year. In exactly the same way, you can analyze hourly volatility, which is more suitable for trading with short expirations.
Technical analysis of binary options using indicators
Indicators are algorithms developed on the basis of mathematical formulas that record price movement and help to understand its direction and dynamics, determining entry points into the market.
Indicators make it possible to conduct technical analysis of binary options for dummies. However, experienced traders do not rely solely on indicators in trading, but use them only as auxiliary tools for subsequent analysis.
Indicators for binary options are a fairly popular method of technical market analysis for a number of advantages, since:
- they are simple and straightforward to use;
- there are many indicators that can be used on any market and any time frame;
- all indicators are built automatically, which simplifies the analysis process.
Indicators are also a popular tool because almost all trading strategies for binary options are based on them.
Indicators are also divided into different types:
- signal;
- trending;
- oscillators;
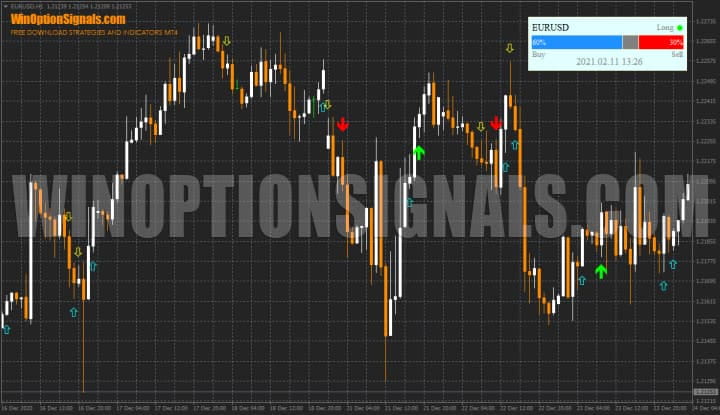
The most popular indicators in the technical analysis of binary options are signal indicators, as they indicate the point in time when Call or Put options can be purchased. Such indicators most often look like arrows, although instead of arrows there may be dots or any other icons. An example of a signal indicator is Trade Confirmed Indicator , which, in addition to signals, also has an information panel:
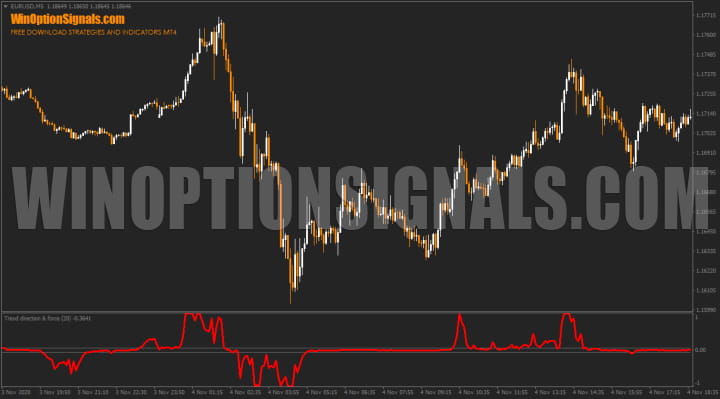
The second most popular are trend indicators , as they indicate the beginning or end of a trend, and can also generate signals for buying options. Their main task is to determine market trends. They can be placed directly on the price chart or at the bottom of it. An example of such an indicator is the Trend Direction Force Index, in which the indicator readings change during market movements, while in a flat the indicator is near the zero level:
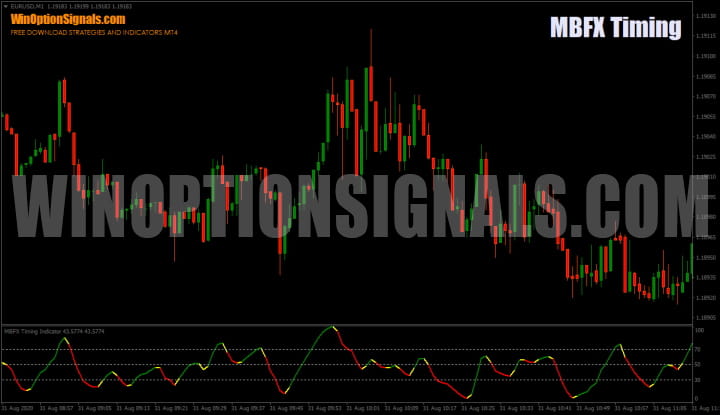
Oscillators are considered leading indicators that quickly respond to impulse movements and show overbought/oversold levels of a trading asset. As a rule, oscillators are placed in a separate window below the price chart (in the “basement”) and oscillate in a limited channel. Oscillators work better during a period of sideways price movement, but when moving to a trend they can give a large number of false signals, which should be taken into account when analyzing binary options. An example of a good oscillator is the MBFX Timing indicator , which indicates price reversals at times of overbought and oversold:
Next, we will consider the most popular indicators of technical analysis of binary options for dummies and experienced traders, on which many trading strategies are based. Such indicators include:
- moving average;
- Ichimoku Kinko Hyo;
- Parabolic SAR;
- RSI;
- Stochastic Oscillator;
- CCI;
- MACD;
- Bollinger Bands.
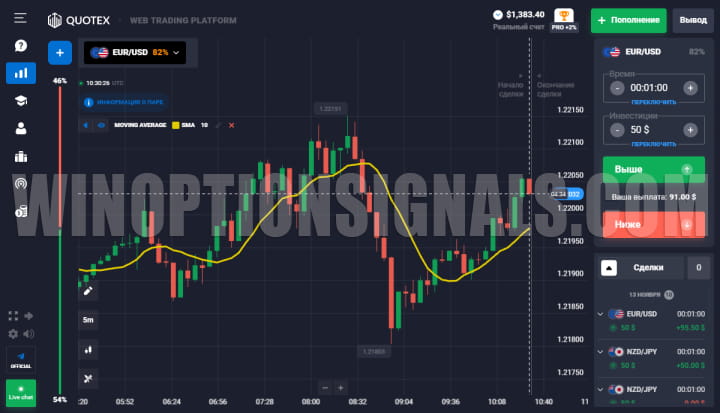
Moving Average . Moving Averages are a basic indicator on any trading platform for binary options and in the MetaTrader 4 terminal and can be simple, weighted, exponential. Also, this trend indicator formed the basis of many more complex tools. The operating algorithm of moving averages is to calculate average quotes for a certain time interval:
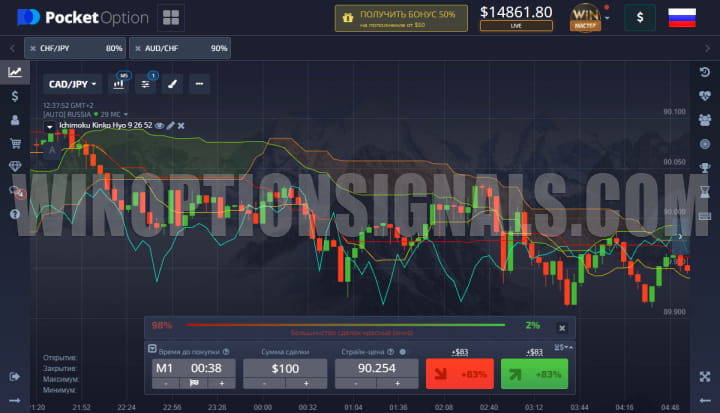
Ichimoku Kinko Hyo . This indicator combines the main and conversion lines, as well as a cloud, which is called Ichimoku. Its algorithm helps determine the optimal moment to open a position, and also shows the direction of the trend, price momentum and support/resistance levels:
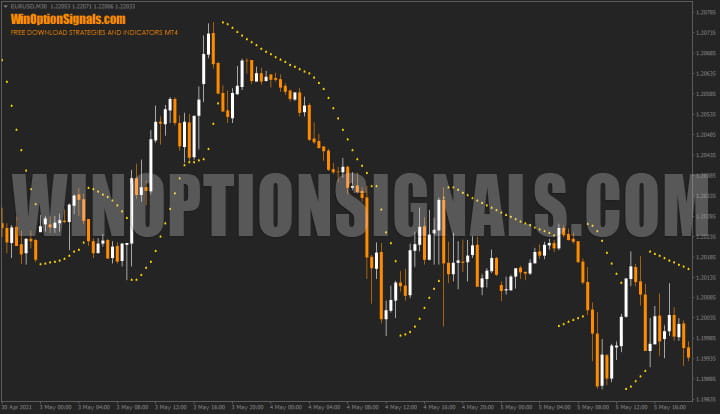
Parabolic SAR . This basic indicator helps determine when a trend will end when using technical analysis of binary options. It is displayed as dots above or below candles/bars. When quotes reverse and trend direction changes, the points change location (from lower to upper or vice versa):
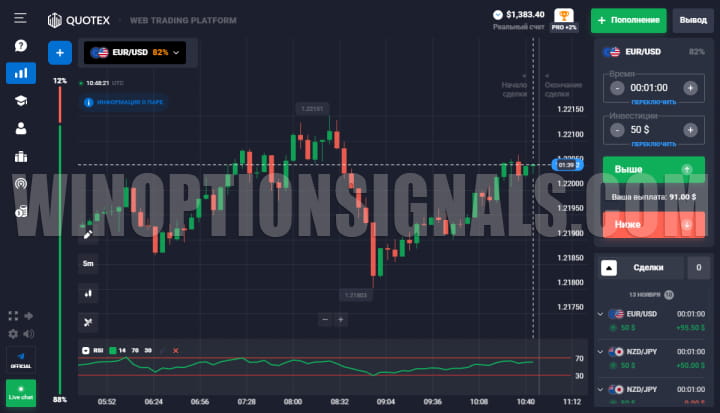
Relative Strength Index (RSI) . RSI is a leading oscillator in the form of a thin broken line, which can enter overbought and oversold zones (most often the levels “30” and “70”), and it can also be used to determine divergences:
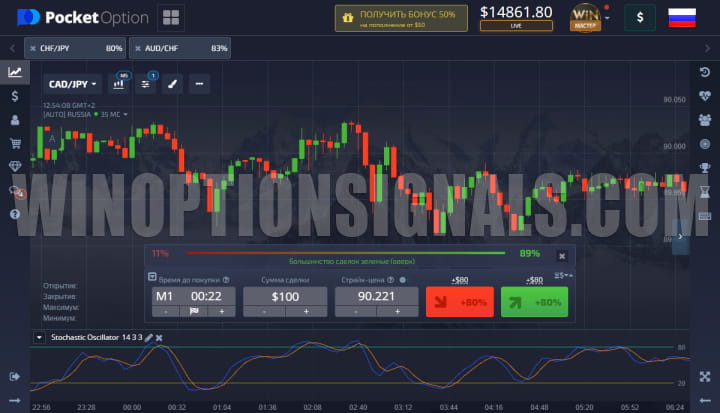
Stochastic Oscillator . The stochastic oscillator works on the principle of combining two lines (fast “%K” and slow “%D”), showing the probability of the price updating the extreme and assessing the speed of the market. A value above the level of “80” means that closing quotes are approaching the upper limit of the range (bullish market), and below the level of “20” - to the lower limit (bearish market). The intersection of the “%K” and “%D” lines may indicate a price reversal:
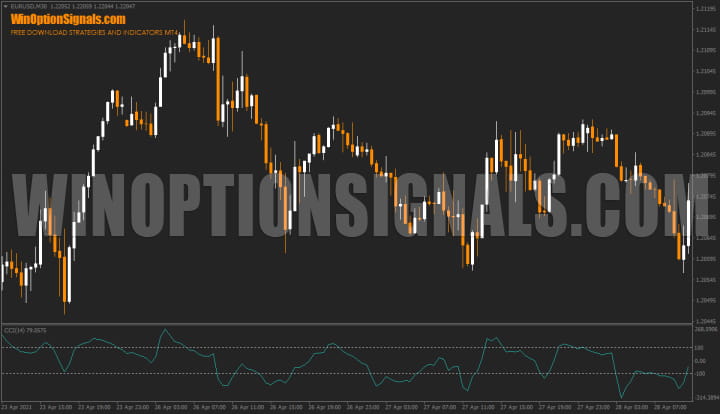
CCI . The Commodity Channel Index was originally developed to calculate cycles in the commodity market, but can be used for technical analysis of binary options. The average line of the indicator is always zero, and the overbought and oversold boundaries are “+100” and “–100”. Exceeding these values signals a possible price reversal:
MACD . MACD combines the properties of a trend indicator and an oscillator, the histogram of which shows to what extent two moving averages (long and short) converged or diverged on the chart. In essence, this indicator is a ready-made strategy that can be used in the technical analysis of binary options. This so-called strategy allows you to determine not only the direction, but also the strength of the trend:
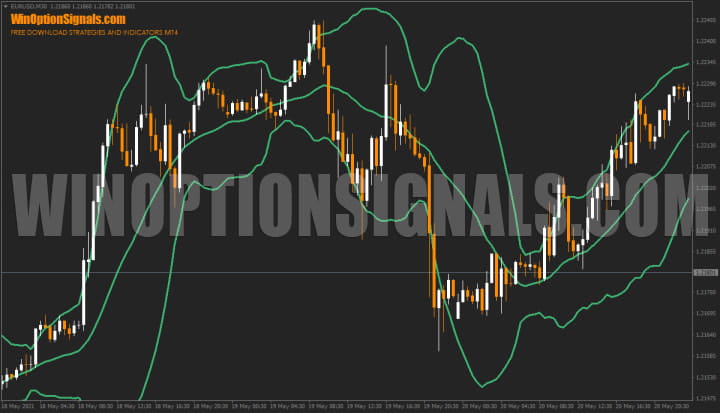
Bollinger Bands . Bollinger Bands are built using three MA lines, two of which are shifted relative to the central line by a certain number of standard deviations (usually two). The bands narrow or widen depending on the market situation and determine extreme points in the process of price movement, and also often provide useful signals for opening positions:
Volumes in technical analysis of binary options
Volume is not the most popular technical analysis tool for binary options trading, but some experienced traders still use it. Thanks to volumes, you can see whether the movements in the market are genuine, or just price noise.
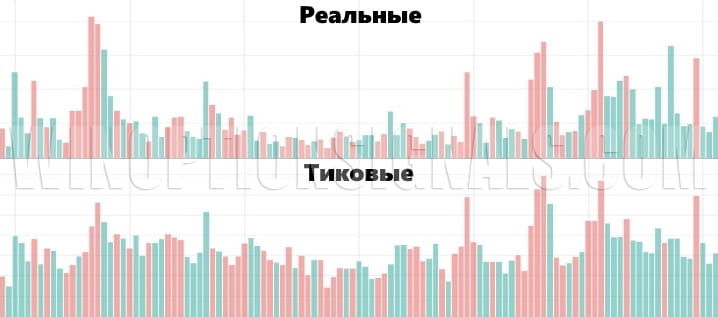
However, there is one problem when using volumes - they cannot be obtained for every asset, since real data on transactions is only available on real exchanges, so many traders use standard tick volumes.
It is important to understand that tick volumes, although they differ from real ones, are not as significant as they might seem:
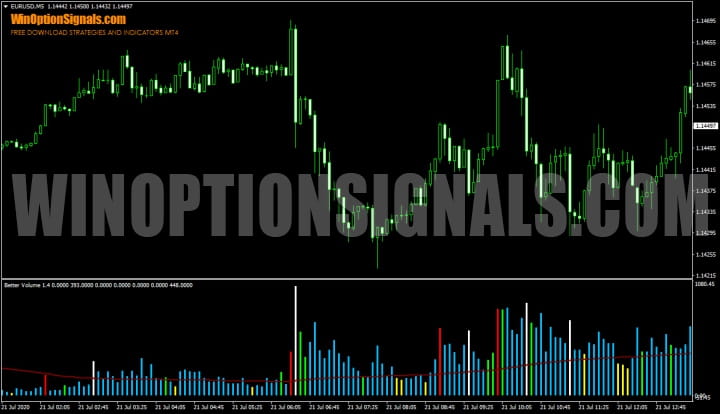
And the most popular tick volume indicator is the Better Volume indicator , which marks the histogram bars with certain colors, which indicates strength, weakness, false breakouts, and so on:
You can learn more about how to correctly trade binary options by volume from our article - “Volumes in binary options trading ”.
Technical analysis of binary options without indicators
It is quite possible to trade binary options profitably on a pure chart without indicators, and some traders base their strategies and systems on just such trading.
One of the methods of trading without indicators is the Price Action method. Many professional speculators conduct technical analysis of binary options based on the configurations of Japanese candlesticks (which change depending on supply and demand), and in this way determine a convenient moment to enter a trade. This method involves trading candlestick patterns such as Pinbar, Engulfing and the like. There are also many other candlestick patterns, some of which can be seen in the image below:
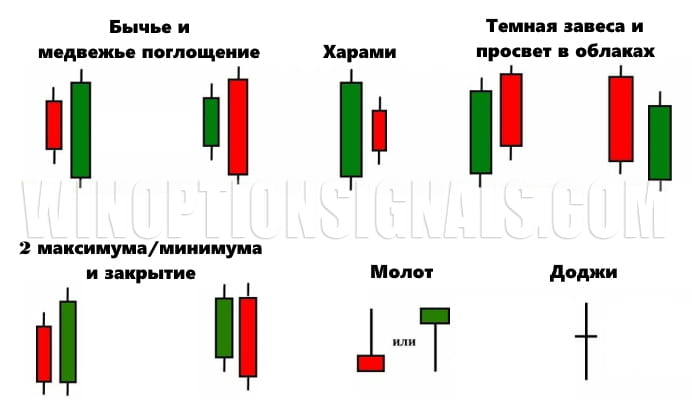
Since there are a huge number of similar candlestick combinations, the easiest way to track them is using the candlestick formation indicator .
It is worth noting that this type of analysis gives the best results when combined with trading by volume, as well as using supply and demand zones (support/resistance).
There is also another method of trading using candlestick patterns, which is based on Japanese candlesticks. This technique is described in detail in the book “Japanese Candlesticks” by Steve Nisson .
Technical analysis figures in binary options
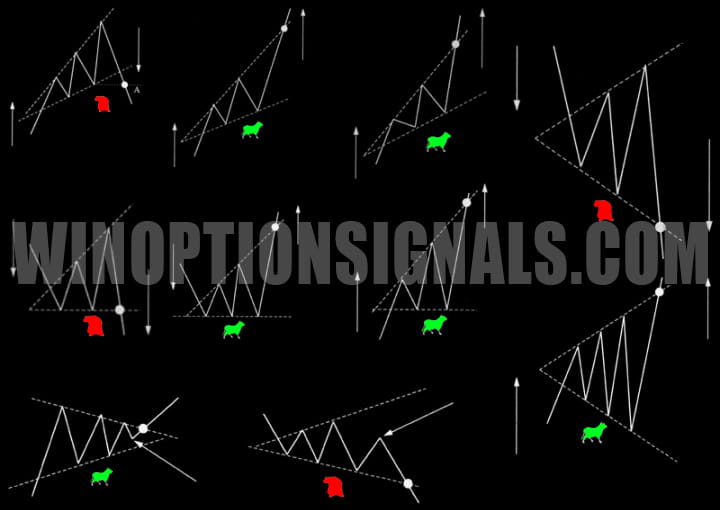
Another popular type of analysis without the use of indicators is trading using graphic patterns, or graphical analysis of binary options . Graphic patterns are price formations that indicate a possible price movement up or down. The patterns that develop on the price line as quotes move are repeated over and over again. Graphic figures are an accurate tool for technical analysis of binary options for dummies and professionals, which helps with a high degree of probability to understand the direction of the price, predict a rebound, rollback or breakdown of the support/resistance line.
The most used formations include:
- triangles (ascending, descending, expanding, contracting);
- double and triple tops and bottoms;
- "head and shoulders".
Next, we will take a closer look at these technical analysis figures in binary options.
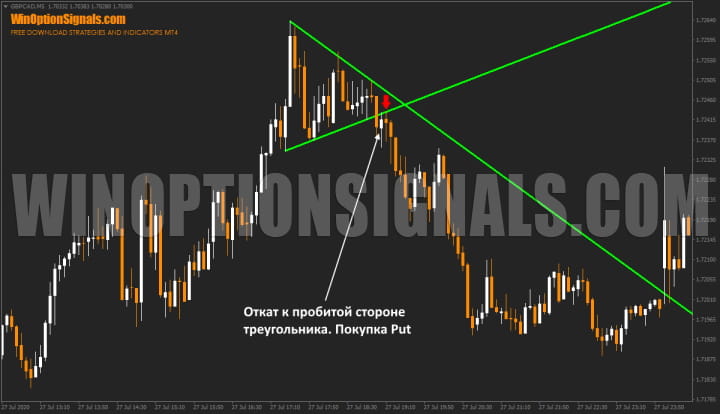
The “triangle” figure is formed when the minimum and maximum price values gradually approach each other and is considered a trend continuation figure. There are several types of triangles and each has its own characteristics:
And here is one of the types of triangles on the graph:
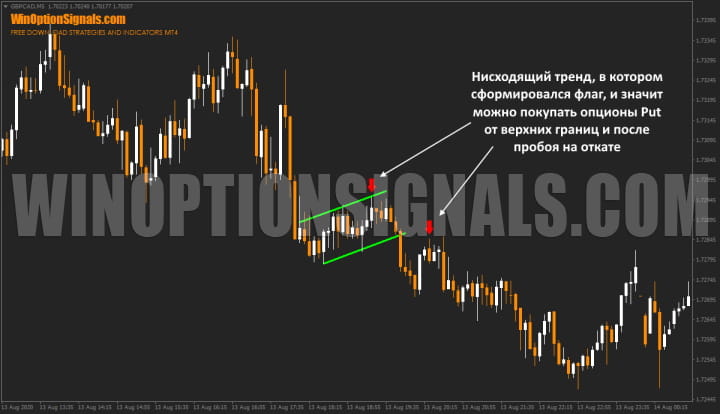
“Flag” is a pattern formed when quotes consolidate in a narrow corridor against the trend. This figure is considered a trend continuation figure and provides an opportunity to enter a trade profitably. On the chart, after an impulse movement, a “flag pole” appears, and then a “panel” is formed - a correction zone limited by support and resistance levels.
If this figure stretches for 20 candles/bars or more, it may not be a flag, but a reversal and the start of a new trend. One of the moments to buy options is to buy a Put from the upper border of the flag and buy a Call from the lower border. However, in binary options trading, technical analysis for novice traders will be more accurate if you wait for confirmation of the movement, which is a breakout of the pattern:
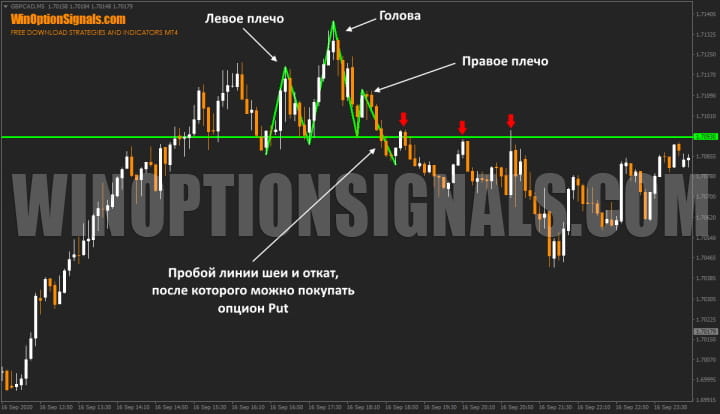
Head and Shoulders is a reversal pattern formed from two low tops and one high top in the center. It can be regular or inverted and appears in both rising and falling markets.
This technical analysis pattern most often shows bulls or bears losing strength. The formation of the second shoulder indicates the end of the trend, since the price can no longer update the minimum or maximum values. The most important element of this pattern in binary options analysis is the neckline, since the pattern is considered complete only when the price breaks through this line and the candle closes lower/higher:
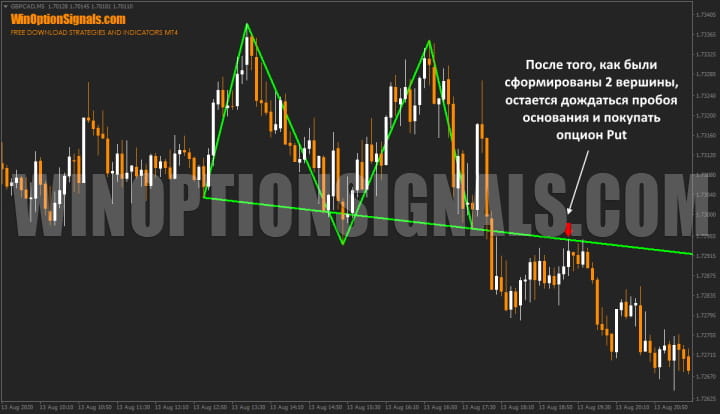
A “double top” or “double bottom” is also a reversal pattern. Includes two peaks of approximately equal height. After the first peak, the price rolls back, then it returns to approximately the same level and rolls back again. This is a sign that quotes will drop even lower. In the double bottom pattern, everything is the same, but in the opposite direction:
You can also use the Price Patterns indicator to quickly find such graphic patterns.
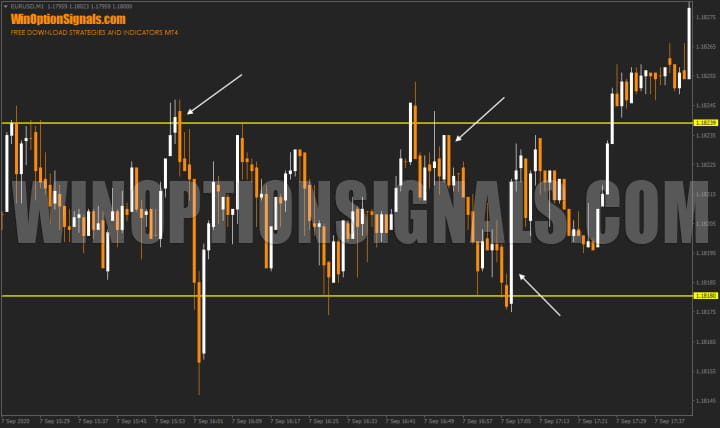
Support and resistance levels
Support and resistance are very important concepts in trading. These are levels on the price chart from which the price previously bounced. The trader’s task during the technical analysis of binary options is to correctly identify these areas, since when they are reached, a sharp rollback of quotes in the opposite direction is likely. Support is drawn based on two minimum extremes. Resistance line – two maximum lines. As quotes approach these levels, the likelihood of a rebound increases. A breakout of the level may indicate a trend change:
Independent technical analysis of binary options
To make technical analysis on binary options for dummies easier, you should adhere to some simple rules:
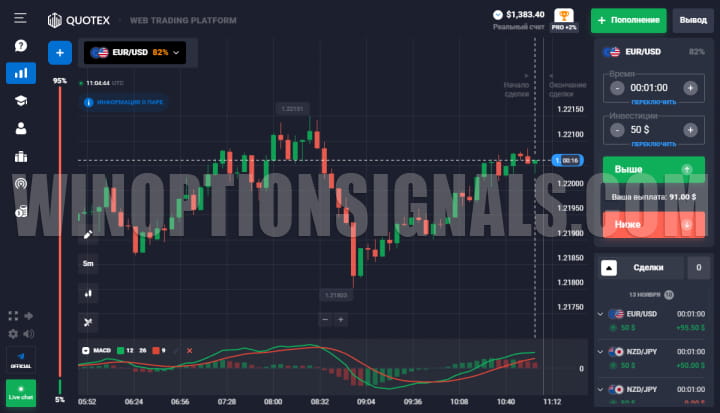
- Binary options brokers . The choice of a broker must be taken very seriously, since the speed and accuracy of order execution depends on the software, which directly affects profits. In addition, in binary options trading, technical analysis is of great importance for beginners, so it is worth paying attention to whether the necessary indicators and graphical tools are built into the trading platform. Brokers such as Quotex , Pocket Option and Deriv have everything you need for binary options analysis;
- Setting up a quote chart. If the chart is initially displayed on the platform in the form of lines, it is better to change it to Japanese candlesticks or bars, which are much more informative and allow for a quick visual assessment of the movement of quotes;
- Selecting a trading instrument. For beginners, it is better to start trading with currency pairs that do not have high volatility. One of the best options is the EUR/USD pair;
- Determining the trend. Determining the trend is very important when conducting technical analysis in binary options, since all tools work best according to the trend;
Technical analysis of binary options is a rather complicated matter for novice traders, and one article cannot cover all the details. To properly understand market processes, you need experience and a deeper study of the material, which can be achieved through efforts, constant training on a demo account , and books on trading for binary options .
Conclusion
Technical analysis of binary options can bring many benefits during trading, but it is definitely worth studying it and choosing the type of technical analysis that will be most convenient and understandable.
Also, trading when using any type of technical analysis of binary options should be carried out only according to the trend, since in a flat, most indicators and patterns may simply not have the expected effect.
And of course, don’t forget about capital and risk management. We wish you successful trading!

See also:
Autochartist: automatic technical analysis
Work by D. Murphy “Intermarket Technical Analysis”
To leave a comment, you must register or log in to your account.