An important skill of every novice and professional trader in binary options trading is not only the ability to determine an upward or downward trend , but also the ability to determine a side trend (flat), since markets spend most of their time in this state.
If we talk about profitability, then most traders will be able to make money without any problems by trading with the trend, since for this they simply need to follow the price, but when a sideways trend occurs, most traders begin to incur losses, and moreover, most of the trading strategies and indicators for binary options they also begin to generate false signals .
What is a sideways trend (flat) in binary options
A sideways trend is a price movement in a range, and this range can be either very narrow or very wide. Sideways trends occur when both buyers and sellers agree on the value of an asset and therefore the price is in a certain range:
This type of trend can be observed in any market and on any time frame , since no asset can be in constant growth or decline.
Whatever strategy or indicator for binary options you trade with, it is always worth either adapting them to a sideways trend, or having a proven strategy created specifically for flat markets.
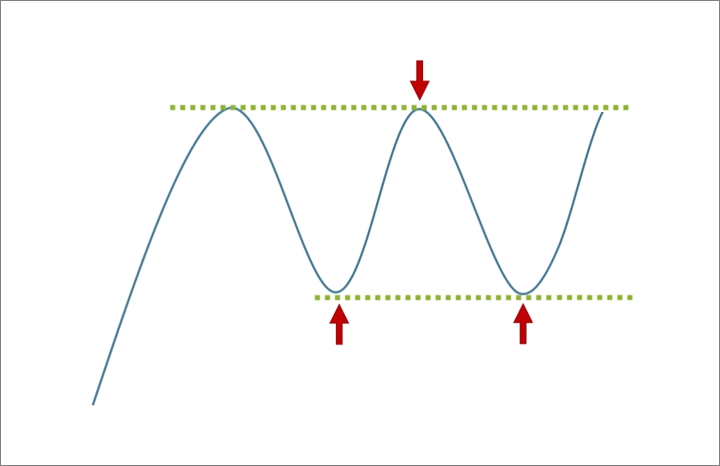
Just as there are different types of bullish and bearish trends , sideways trends can also be of different types. Sometimes you can observe the so-called “ideal” sideways trend:
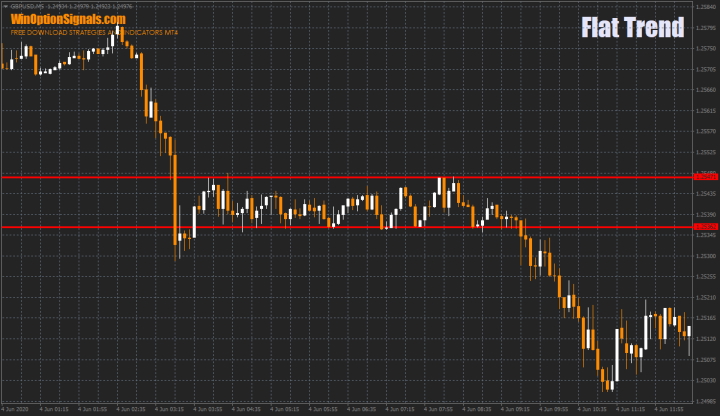
In such a flat there are clear boundaries and the price does not go beyond them until an upward or downward trend begins. But sideways trends can be very confusing and incomprehensible:
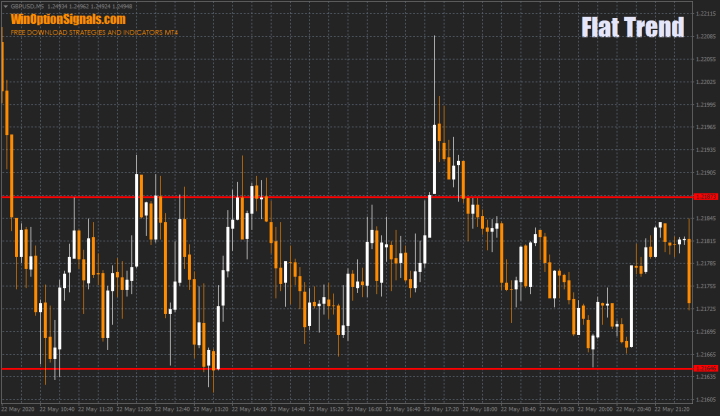
In this case, you can also observe a flat, but there are many false breakouts in it and sometimes you can even see price formations that will give false assumptions about the direction of future price movement.
How to trade binary options during a sideways trend (flat)
Sometimes it may seem that during a flat no one makes transactions in the market and the price simply “floats” in the range, but in fact many transactions are made at any time, including during a sideways trend. Those who have studied the phases of a trend (accumulation/distribution) know that it is during a “flatness” that large positions accumulate, due to which later a movement in one direction begins.
Traders who trade only large movements always avoid flat market conditions, and this is very correct for such a strategy. But fans of scalping can make transactions at any time and it doesn’t matter to them which way the price goes.
Scalping during a flat is quite easy in technical terms and the trading rules are very simple, but what is difficult with such trading is maintaining discipline and keeping emotions under control. Without a trading psychologist, no one will be able to trade binary options profitably, even with the most profitable strategy.
And yet, if we talk about the rules, then you need to buy Call options when the price approaches the lower border of the channel (support), and you need to buy Put options when the price approaches the upper border (resistance):
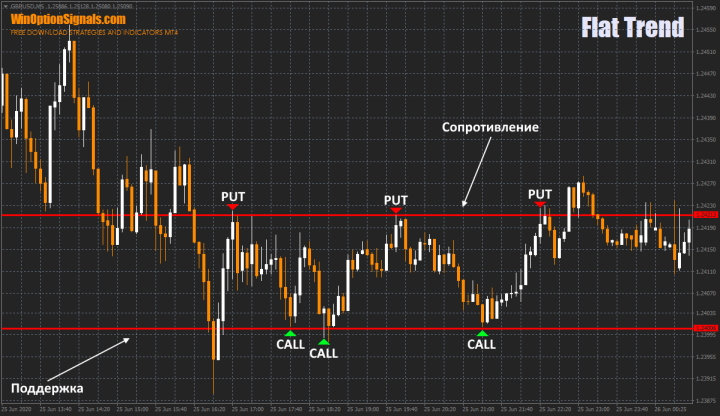
Please note that you should choose the expiration length based on the width of the flat, but if we talk about M5 charts and the width of the range of 20 points (on 4-digit quotes), then 3-4 candles would be a suitable option.
It is important to remember that as soon as a flat breaks through (usually it is either one long candle or several candles that close beyond the flat border in the direction of the breakout), then you should stop trading in this range.
Indicators for determining flats in the binary options market
At first, it is difficult for new traders to determine by eye which trend is currently prevailing in the market, and to confirm their assumptions, you can use some standard indicators of the MetaTrader 4 terminal .
The first and simplest is the Alligator indicator by Bill Williams. This indicator consists of three Moving Averages with certain settings, which makes it easy to determine the time of a sideways trend in the market:
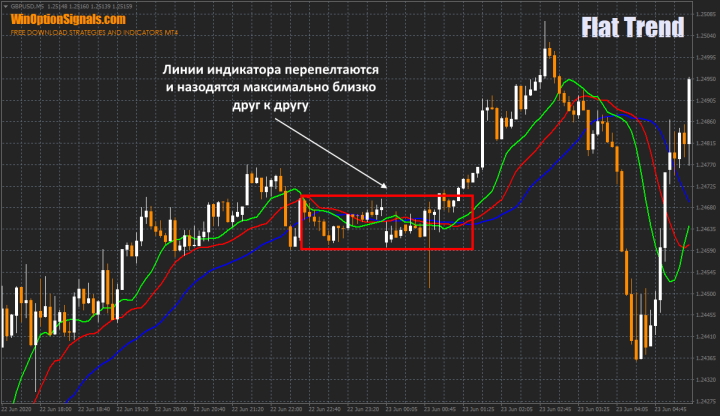
As you can see, during moments of unidirectional price movement, the Alligator lines are far from each other, but during a flat they intertwine and move away by no more than a few points.
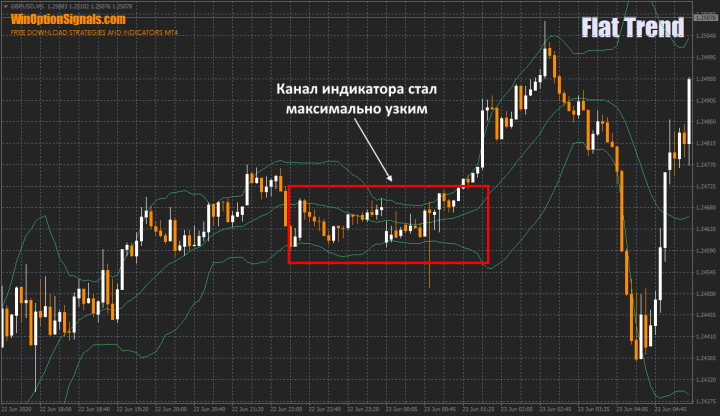
Another indicator for determining a sideways trend can be Bollinger Bands , and its principle is similar to the previous example. During moments of a trend, the indicator channel widens, but during moments of flat it becomes noticeably narrow:
The third and more complex indicator is ADX (Average Directional Movement) . It can also be used to determine the presence of a sideways trend:
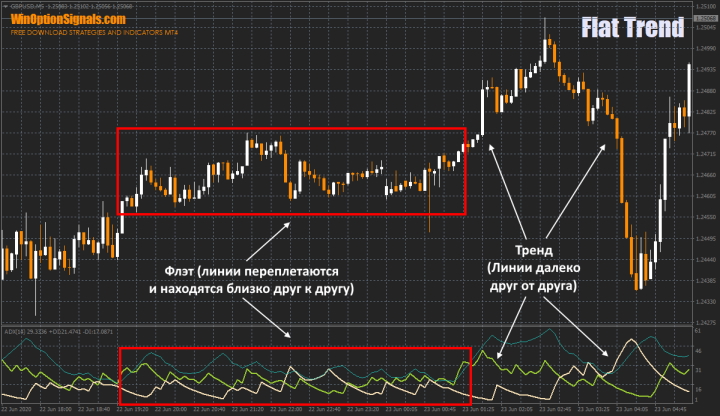
Please note that to determine the trend it is necessary to observe the thick lines (green and beige) and the principle of operation of these lines is very similar to the previous examples.
Conclusion
When flat trading is carried out with currency pairs on the Forex market or cryptocurrencies on crypto exchanges , it is rare to get a good profit, since flat ranges are most often very narrow, but for binary options this does not matter, since the profit on them does not depend on the number of points passed. Therefore, with the right approach, you can make the same profit during a sideways trend as during strong trends.
But in no case should we forget that even when trading is “honed” to the smallest detail, it is always worth using the rules of money management and risk management , and each approach should always be checked on history or a demo account .

See also:
What novice traders need to know about binary options
To leave a comment, you must register or log in to your account.